Abstract
Cocoa and coffee are natural sources of phenolic compounds, which are degraded during beans processing of both. For this reason, there is an interest in obtaining extracts of these bio compounds. The aim of this study was uncovering the radical scavenging activity (AC) of mixtures of cocoa and coffee extracts, and the bio-availability of their phenolic compounds, resorting to in vitro models: DPPH and ORAC antioxidant methods, and the characterization of the trans-epithelial transport of cocoa and coffee phenolics through Caco-2 cells monolayer model of the intestinal barrier. The cocoa displayed a higher AC than the coffee regarding both DPPH and ORAC assays, while the mixtures increased in parallel with the percentage of cocoa in the blends. The combination index was calculated to set up the type of interaction in the cocoa-coffee mixtures, obtaining that the mixture 25:75 was moderately antagonistic, 50:50 nearly additive, and 75:25 slightly synergistic. The absorption efficiency of the cocoa phenolic compounds was between 87.9%–97.4%, in the coffee compounds was 100%. The mixtures varied according to the proportion of cocoa and coffee. The results obtained allowed concluding that the phenolic compounds present in cocoa and coffee, respectively, are featured by high bioavailability and a valuable antioxidant capacity, while no pattern was found in the mixtures concerning the real benefit of using them combined.
Keywords
Flavanols, catechins, chlorogenic acids, biological activity, radical scavenging capacity
Date received: 18 December 2020; accepted: 19 May 2021
Introduction
Cocoa is a natural source of polyphenols, containing 12%–18% on a dry weight basis, which are classified into three groups: flavan 3-ols (catechins and epicate-chins), anthocyanins, and procyanidins; representing 37%, 4%, and 58% respectively, of the total antioxidant composition reported in raw unfermented cocoa beans (Hu et al., 2016; Wang et al., 2019).
 Alternatively, chlorogenic acids are the most abundant phenolic compounds present in coffee, including several quinic acid esters, representing from 7% to 10% of its dry matter. The most relevant chlorogenic acid is 5-O-caffeoylquinic, an ester of caffeic acid and quinic acid (Budryn et al., 2016; Gil, 2012). In the food industry, there is an interest in searching for technologies that allow the extraction and concentration of such compounds, to incorporate them into different products to contribute to the health of consumers. In the case of the cocoa and coffee industry, this is important because the traditional processing of them leads to losses of these biologically active compounds (Todorovic et al., 2015).
The term “bioactive compound” is referred to nutrients and non-nutrient present in foods and responsible, after intestinal absorption, for an array of biological activities that could contribute to main- taining human health and well-being (Fernandes et al., 2012). In this respect, to the present date, several stud- ies have allowed identifying the beneficial effects of bioactive compounds supplied by cocoa- and coffee- based products on health, being the bioactivities identified so far, mainly associated with their radical scavenging capacity. Hence, nowadays, it has been reported the benefits of cocoa on cardiovascular health, diabetes, and blood pressure, as well as on cognitive and brain functions (Balzer et al., 2008; Pokorney and Piccini, 2017; Sokolov et al., 2013). On the other hand, the health benefits of the bioactive compounds present in coffee have been associated with their preventive role against inflammatory and mutagenic events, as well as cardiovascular and rheumatic diseases (Budryn et al., 2016), while other studies have shown that antioxidant compounds present in coffee are competent to inhibit lipid peroxidation on low-density lipoproteins (LDL)-cholesterol, thus playing a role regarding the modulation of oxidative stress and reducing the risk of atherosclerosis (Agudelo-ochoa et al., 2016; Lara-Guzma ́n et al., 2016).
 Despite the currently generated knowledge on these plant-based food matrices, there are not many studies focused on combinations of cocoa and coffee as sources of bioactive compounds, including the exploration of interactions between bioactive compounds supplied by each separate matrix in terms of bioavailability and bioactivity. In this aspect, C ̧elik and Gokmen (2018) € studied possible molecular interactions and their effect on the antioxidant capacity of flavanols present in cocoa infusions: (þ) catechin and ()-epicatechin. This research allowed describing, in some specific mixtures, synergistic, additive, and antagonistic behaviors. Other authors (Ribeiro et al., 2014) have evaluated cocoa, coffee silverskin, and green coffee minimally processed mixtures, describing that the obtained blend (94% roasted coffee powder (Coffea canephora cv. Robusta and Coffea arabica, 70/30, w/w), 3% cocoa powder, 2% coffee silverskin, and 1% golden coffee (green coffee minimally processed), was featured by the highest content of bioactive compounds and radical scavenging power.
Based on these premises, the present research aims to understand the interaction of phenolic compounds in cocoa (flavanols) and coffee extracts (chlorogenic acid) and diverse mixtures (0–100, 25:75, 50:50, 75:25, 100:0 cocoa:coffee) to establish synergies or antagonism and understand their bioavailability through the transepithelial transport by Caco-2 cells.
MATERIALS AND METHODS
Chemicals and reagents
All solvents (methanol, glacial acetic acid, ethanol, isopropanol, HCl, acetone) were analytical grade and supplied by Merk (Merk, Darmstadt, Germany). The water deionized in a Milli-Q water purification system (Millipore, Bedford, USA). The standards of (þ)-catechin, (–)-epicatechin, chlorogenic acid, ()-6-Hydroxy- 2,5,7,8-tetramethyl-chromane-2-carboxylic acid(Trolox), 2,2-diphenyl-1-picrylhydrazyl radical (DPPH), 2,2’ Azobis(2-methyl-propionamidine) dihydrochloride (APPH), non-essential amino acids (NEAAs), fetal bovine serum (FBS), Eagle’s minimum essential medium (EMEM), and L-glutamine were purchased to Sigma Aldrich (Steinheim, Germany). Methanol was from Carlo Erba, France and ethanol, sodium di-Hydrogen phosphate anhydrous (Na2HPO4), and di-Sodium Hydrogen phosphate anhydrous (NaH2PO4) from Panreac ApplichemGmbH (Darmstadt, Germany). Fluorescein was purchased to Fluka analytical (England, United Kingdom).
Plant material and preparation of coffee-cocoa mixtures
The cocoa powder extract was supplied by the Compañía Nacional de Chocolates S.A.S.-CNCH (Rionegro, Colombia) and the coffee powder extract was from Industria Colombiana de Cafe S.A.S (Medellín, Colombia). The blends of coffee and cocoa were prepared to mix them at the proportions referred to in Table 1. Mixed samples (10 mg) were diluted in 10 mL of deionized water, stirred by vortex, and cen- trifuged at 10.500 rpm for 5 min (Sigma 1-13 centrifuge, B. Braun Biotech International, Osterode, Germany), at room temperature. The supernatants were filtered through a 0.45 mm PVDF membrane Millex HV13 (Millipore Sigma, Bedford, U.S.A.) and appropriately diluted according to each further determination’s sensitivity.
Hplc analysis of flavanols of cocoa
 The chromatographic analysis was developed on an Agilent 1260 high-resolution liquid chromatography (Agilent Technologies, CA, USA) with automatic auto-sampler, fluorescence, and diode array detectors (FLD and DAD). The signals were processed using the Agilent OpenLAB CDS software, ChemStation Edition. The samples were prepared following the methodology proposed by Tsanova-Savova et al. (2005). The extraction of the cocoa samples (0.5 g) was done by adding 10 mL of isopropanol/deionized water (60:40, v/v), pH 9.0 for 60 min in an Elma E30H ultrasonic bath (Elma Schmidbauer GmbH, Singen, Germany), at room temperature. Afterward, these samples were stirred in a vortex for 1 min and stored at –20 C for 60 min. The samples were centrifuged at 4000 rpm for 8 min in al Rotofix 32 A centri- fuge (Andreas Hettich GmbH & Co.KG, Schwerin, Germany). The supernatant (1 mL) was collected and filtered through a 0.45 mm Nylon membrane filter (Millipore, Membrane Solutions, Auburn, USA) and performed in a chromatography vial to be analyzed by HPLC/DAD/FLD. The chromatographic separation was in a Zorbax bonus C18 HPLC Column (250 4.6 mm, 5 mm particle size). The chromatograms were recorded at 280 nm and analyzed using the OpenLab CDS Chemstation Edition software. A pool of authentic external standards of (þ) catechin, (–)-epicatechin, caffeine, and theobromine was applied to quantify the compounds. The analysis of the diverse mixtures was performed on three replicates and reported as micrograms per milliliter (mg/mL).
Hplc analysis of chlorogenic acids of coffee
The evaluation of chlorogenic acids content in the coffee extract was carried out by reverse-phase high resolution liquid chromatography (RP-HPLC), coupled to a UV–Vis or DAD detector, following the methodology described by the Deutsche Institut für Normung in the DIN 10767 (1992). Accordingly, for the analysis, it was required a methanolic extraction to guarantee the precipitation of proteins. The samples were then centrifuged at 4000 rpm for 10 min in a Rotofix 32 A centrifuge (Hettich, Tuttlingen, Germany) and filtered through a 0.45 mm Nylon membrane filter (Millipore, Membrane Solutions, Auburn, USA).
 Afterward, the samples were injected into the HPLC system, including a G1311C quaternary pump and a G1315D diode array detector. The chromatographic separation was on a ZORBAX Eclipse XDB C18 column (150 x 4.6 mm, 3.5 mm particle size) (Agilent, Santa Clara, USA). The detection was at 325 nm. In this chromatographic system, nine chlorogenic acids were separated: 5-caffeoylquinic acid (5-CQA), 3-caffeoylquinic acid (3 CQA), 4-caffeoylquinic acid (4-CQA), caffeic acid, ferulic acid, isopherulic acid, 3,4-dicaffeoylquinic acid (3,4 di-CQA), 4,5-dicaffeoylquinic acid (4,5 di-CQA) and 3,5-dicaffeoylquinic acid (3,5 di-CQA). The total content of chlorogenics was reported as the sum of each concentration quantified to authentic external standards and expressed as ug/ml of chlorogenic acids.
Dpph and ORAC-based antioxidant capacity
Dpph assay. For the assessment of the samples on their radical scavenging capacity, DPPH assays were developed using 96-well microplates (Nunc, Roskilde, Denmark), following the methodology previously described by Migues et al. (2018). The antioxidant activity was evaluated measuring changes of absor- bance at 515 nm, after 35 min of reaction with the radical DPPH_ (2 mL of the sample diluted in H2O (1:2, v/ v) þ 250 mL of DPPH_ solution up to absorbance 1) using and an InfiniteVR M200 microplate reader (Tecan, Grodig, Austria € ). The standard curve exhibited linearity between 10 and 200 mM Trolox. The results were expressed as millimolar of Trolox equivalents per gram of dry weight (mM TE/g dw) by applying the indicators stated in Table 2.
 Orac assay. The assessment of samples on the ORAC-based antioxidant activity was carried out according to the methodology described by Paulsen et al. (2018), using 96-well microplates. Briefly, peroxyl radical was prepared using 2,20-azobis (2-amidino-propane) dihydrochloride for each run, and fluorescein was used as a substrate of the reaction. For this method, the samples were diluted in water (1:50, v/v). Fluorescence conditions were as follows: excitation at 485 nm and emission at 520 nm, both read using an InfiniteVR M200 microplate reader (Tecan, Grodig, € Austria). The standard curve was linear between 10 and 200 mM Trolox. The results obtained were expressed as mM TE/g dw.
Assessment of main phenolics transport with Caco-2 model
The human colorectal adenocarcinoma cell line (Caco-2, ATCCVR HTB37) was obtained from the American Cell Culture Collection (ATCC, Rockville, MD, USA). These cells were grown at 37 C in a humidified atmosphere containing 5% CO2, in Eagle’s Essential Minimum Medium (EMEM), supplemented with 10% fetal bovine serum, 1% (v/v) NEAAs, and 2 Mm L-glutamine. The cells used in this study corre- sponded to the pass number 15.
 To assess phenolic compounds’ bioavailability, present in the cocoa, coffee, and cocoa-coffee mixtures, an in vitro model of intestinal barrier developed using Caco-2 cells was applied. For this purpose, Caco-2 cells were seeded at a density of 3×10⁵ cells/well in 300 mL of culture medium on advanced inspection sys- tems (HTS)-TranswellVR-12 well, semi-permeable (0.4 mm pore diameter polyester membranes) (apical chamber) (Costar, Corning, Birmingham, UK). In the lower compartment (basolateral compartment), 600 mL of culture medium was added. Once confluent, seeded Caco-2 cells were allowed to differentiate for 21 days before the experiments, replacing the culture medium every 48–72 h. The cell mono-layer’s integrity was evaluated by determining the transepithelial electrical resistance (TEER), using a commercial measurement system Millicell ERS (Millipore Co., Bedford, MA) that includes Ag-AgCl electrodes, according to the manufacturer’s instructions. The final values expressed in X/cm2 were calculated according to the following equation: ‘TEER 1⁄4 (R– Rb) x A’, where ‘R’ is the electrical resistance of the filter insert with the cell layer, ‘Rb’ is the resistance of the filter alone, and ‘A’ is the growth area of the filter in cm2. Only those inserts that presented a TEER value higher than 600 X/cm2 were used for the bioavailability experiments.
 For the development of the bioavailability experiment, 20 mL of the analytical extracts were added to 300 mL of the fresh medium in the apical chamber. The transport from the apical to the basolateral cham- ber was evaluated after 120 min of incubation at 37 C in a humidified atmosphere containing 5% CO2. That time was defined because it simulates the regular period in which food remains in the small intestine (Bonetti et al., 2016). Afterward, the apical and basolateral chambers’ culture media were collected and dried using a SpeedVac concentrator Savant SPD121P (Thermo Scientific, MA, USA). The dry residue was suspended in methanol, filtered through 0.45 mm microfilters, and stored at –20 C until chromatographic analysis.
The phenolic transport was evaluated, collecting culture media from the apical and basolateral chambers. Subsequently quantified regarding their content of (þ)-catechin, (–)-epicatechin, and chlorogenic acid by HPLC-DAD-ESI-MS/MS analysis. Results on absorption efficiency were expressed as a percentage of the compounds available for absorption in the apical chamber, according to the following equation: ‘Absorption efficiency (%) 1⁄4 (Concentration in the basolateral chamber culture media at min 120/ Concentration in the apical chamber culture media at min 0) x 100’ (4).
Hplc-DAD-ESI-MS/MS analysis
As referred above, the samples were analyzed by reverse-phase chromatography HPLC-DAD-ESI-MS/ MS, applying the method proposed by Kern et al. (2003). The phenolic compounds detected in the extracts (catechins, epicatechins, and chlorogenic acids) were separated using a C18 Luna column (250 4.6 mm, 5 mm particle size) (Phenomenex, Macclesfield, UK). For the chromatographic separation, the solvents A (acetonitrile/formic acid (99:1, v/v)) and B (methanol), were used upon the following linear gradient scheme (t in minutes; %B): (0; 5%), (15; 15%), (30; 30%), (40; 50%), (45, 95%), and (50; 5%).
The flow rate and volume of injection were 1 mL/min and 10 mL, respectively. The chromatographic analysis was done on an Agilent HPLC 1100 series chromatograph equipped with a binary pump model G1312A, autosampler model G1313A, in-line degasser model G1322A, diode detector model G1315B, and an in-line mass spectrometer (Agilent Technologies, Waldbronn, Germany), controlled by the ChemStation software (Agilent, version 08.03). The phenolic acids were quantified based on standard curves developed using authentic standards at the following wavelengths: chlorogenic acids 320 nm, (þ)-catechin, and (–)-epicatechin 280 nm.
Statistical analysis
The results were presented as the mean SD (n 1⁄4 3). A one-way analysis of variance (ANOVA) was performed to establish significant differences between mixtures. The statistical treatment of the data was done using the R-statistical language (R Development Core Team, 2019). Statistically significant differences were set-up atp < 0.05.
RESULTS AND DISCUSSION
Quantitative profile of (1)-catechin, (2)-epicatechin, and chlorogenic acid of cocoa, coffee, and cocoa coffee mixtures
For the analysis of the bioavailability of flavanols and phenolic acids present in the cocoa-coffee mixtures the concentration of (þ)-catechin, (–)-epicatechin was measured, catechin dimer, and chlorogenic acids. As mentioned before, the compounds were identified according to their retention time, DAD-spectra, and fragmentation pattern in comparison with authentic standards. Thus, catechin dimer, (þ)-catechin, and (–)-epicatechin corresponded to peaks recorded at retention times 9.2, 10.7, and 13.9 min., respectively, with the maximum absorption at 280 nm wavelength. The fragmentation patterns (arbitrary mass units (amu) of the parent and specific productions) for these flavanols were m/z 289 > 1,09,123 ((-)-epicatechin), m/z 289 > 123, 145 amu ((þ)-catechin), and m/z 576.8 > 289.1, 124.7 amu (catechin dimer). On the other hand, the peak corresponding to chlorogenic acid was found at 12.5 min and presented the following fragmentation pattern m/z 353.0 > 191.0 amu, recorded its highest absorption ratio at 320 nm. The concentration of these compounds was closely dependent on the mixture (Table 3). In each com- pound, the concentrations between M1 and M5 (0:100; 100:0 cocoa: coffee, respectively) were as follows: in the case of catechin dimmer, the values were between 8.06–2641.48 mg/mL.
 In the (þ)-catechin 15.61–51.51 mg/mL, (–) epicatechin 0.00–568.92 mg/mL and chlorogenic acid 0.43–0.00 mg/mL. Regarding flavanols, the highest concentration of the catechin dimer was from 25:75 to 100:0 in cocoa-coffee mixtures (2744.93 mg/mL, on average). The highest concentration obtained was in 25:75 (2848.38 mg/mL). A similar trend was observed to (þ)-catechin, and (–)-epicatechin; the highest concentrations were from 50:50 to 100:0 in cocoa-coffee mixtures ((þ)-catechin 1⁄4 44.08 mg/mL and (–)-epicatechin 1⁄4 492.03 mg/mL, on average). The behaviour of the chlorogenic acids was inverse to that of the flavanols, corresponding the highest concentration to the 0:100 (cocoa-coffee) mixture (0.43 mg/mL), which decreased in parallel with the augment of the cocoa percentage up to the absence of this phenolic acid in the 100:0 (cocoa- coffee) mixture.
Radical scavenging activity of coffee-cocoa mixtures
Dpph-based antioxidant capacity. Parallel to the cocoa proportion in the mixtures, the AC increases, which would indicate a more prominent antioxidant activity of the cocoa phenolics. Hence, the average DPPH• scavenging activity for the M1 (0:100 cocoa-coffee) mixture was 1.109 mM TE/g dw, which is in good agreement with the results reported by C ̧elik and Gokmen (2018) for different coffee infusions € (1.095–1.184 mM TE/g dw). However, this was the lowest AC relative to the other mixtures assessed in the present work (Table 4). However, the highest average DPPH• scavenging activity corresponded to the 100% cocoa extract (M5), with almost 2.5 mM TE/g dw. In addition, significant differences were found between the later matrix and the additional mixtures characterized (p < 0.05) that exhibited values in the following decreasing order: 75:25 (cocoa-coffee) (1.939 mM TE/g dw) > 50:50 (cocoa-coffee) (1.743 mM TE/g dw) > 25:75 (cocoa-coffee) (1.513 mM TE/g dw) (Figure 1 and Table 4).
Concerning the DPPH• scavenging capacity of the cocoa-coffee mixtures, significant differences were founded between 25:75 and 75:25 that in turn exhibited significantly higher and lower AC relative to 100% cocoa and coffee extracts, respectively (Table 4). These findings allow assuming the high radical scav- enging potential of the cocoa extract used in low
Table 3. Concentration in the mixtures (mg/mL) of the flavanols and phenolic acids considered for the bioavailability analysis.
Table 4. DPPH and ORAC-based antioxidant capacity (mM TE/g dw) and interaction of the mixtures. The values correspond to the mean and the standard deviation of the three analyses. Mean values with different letters in the same column show statistically significant differences (p < 0.05). %I: percentage of inhibition of the DPPH radical; CI: the combination index to establish the type of interaction between the mixtures; IC50: half maximal inhibitory concentration that indicates the amount of the bioactive compound that can inhibit 50% of the DPPH radical.
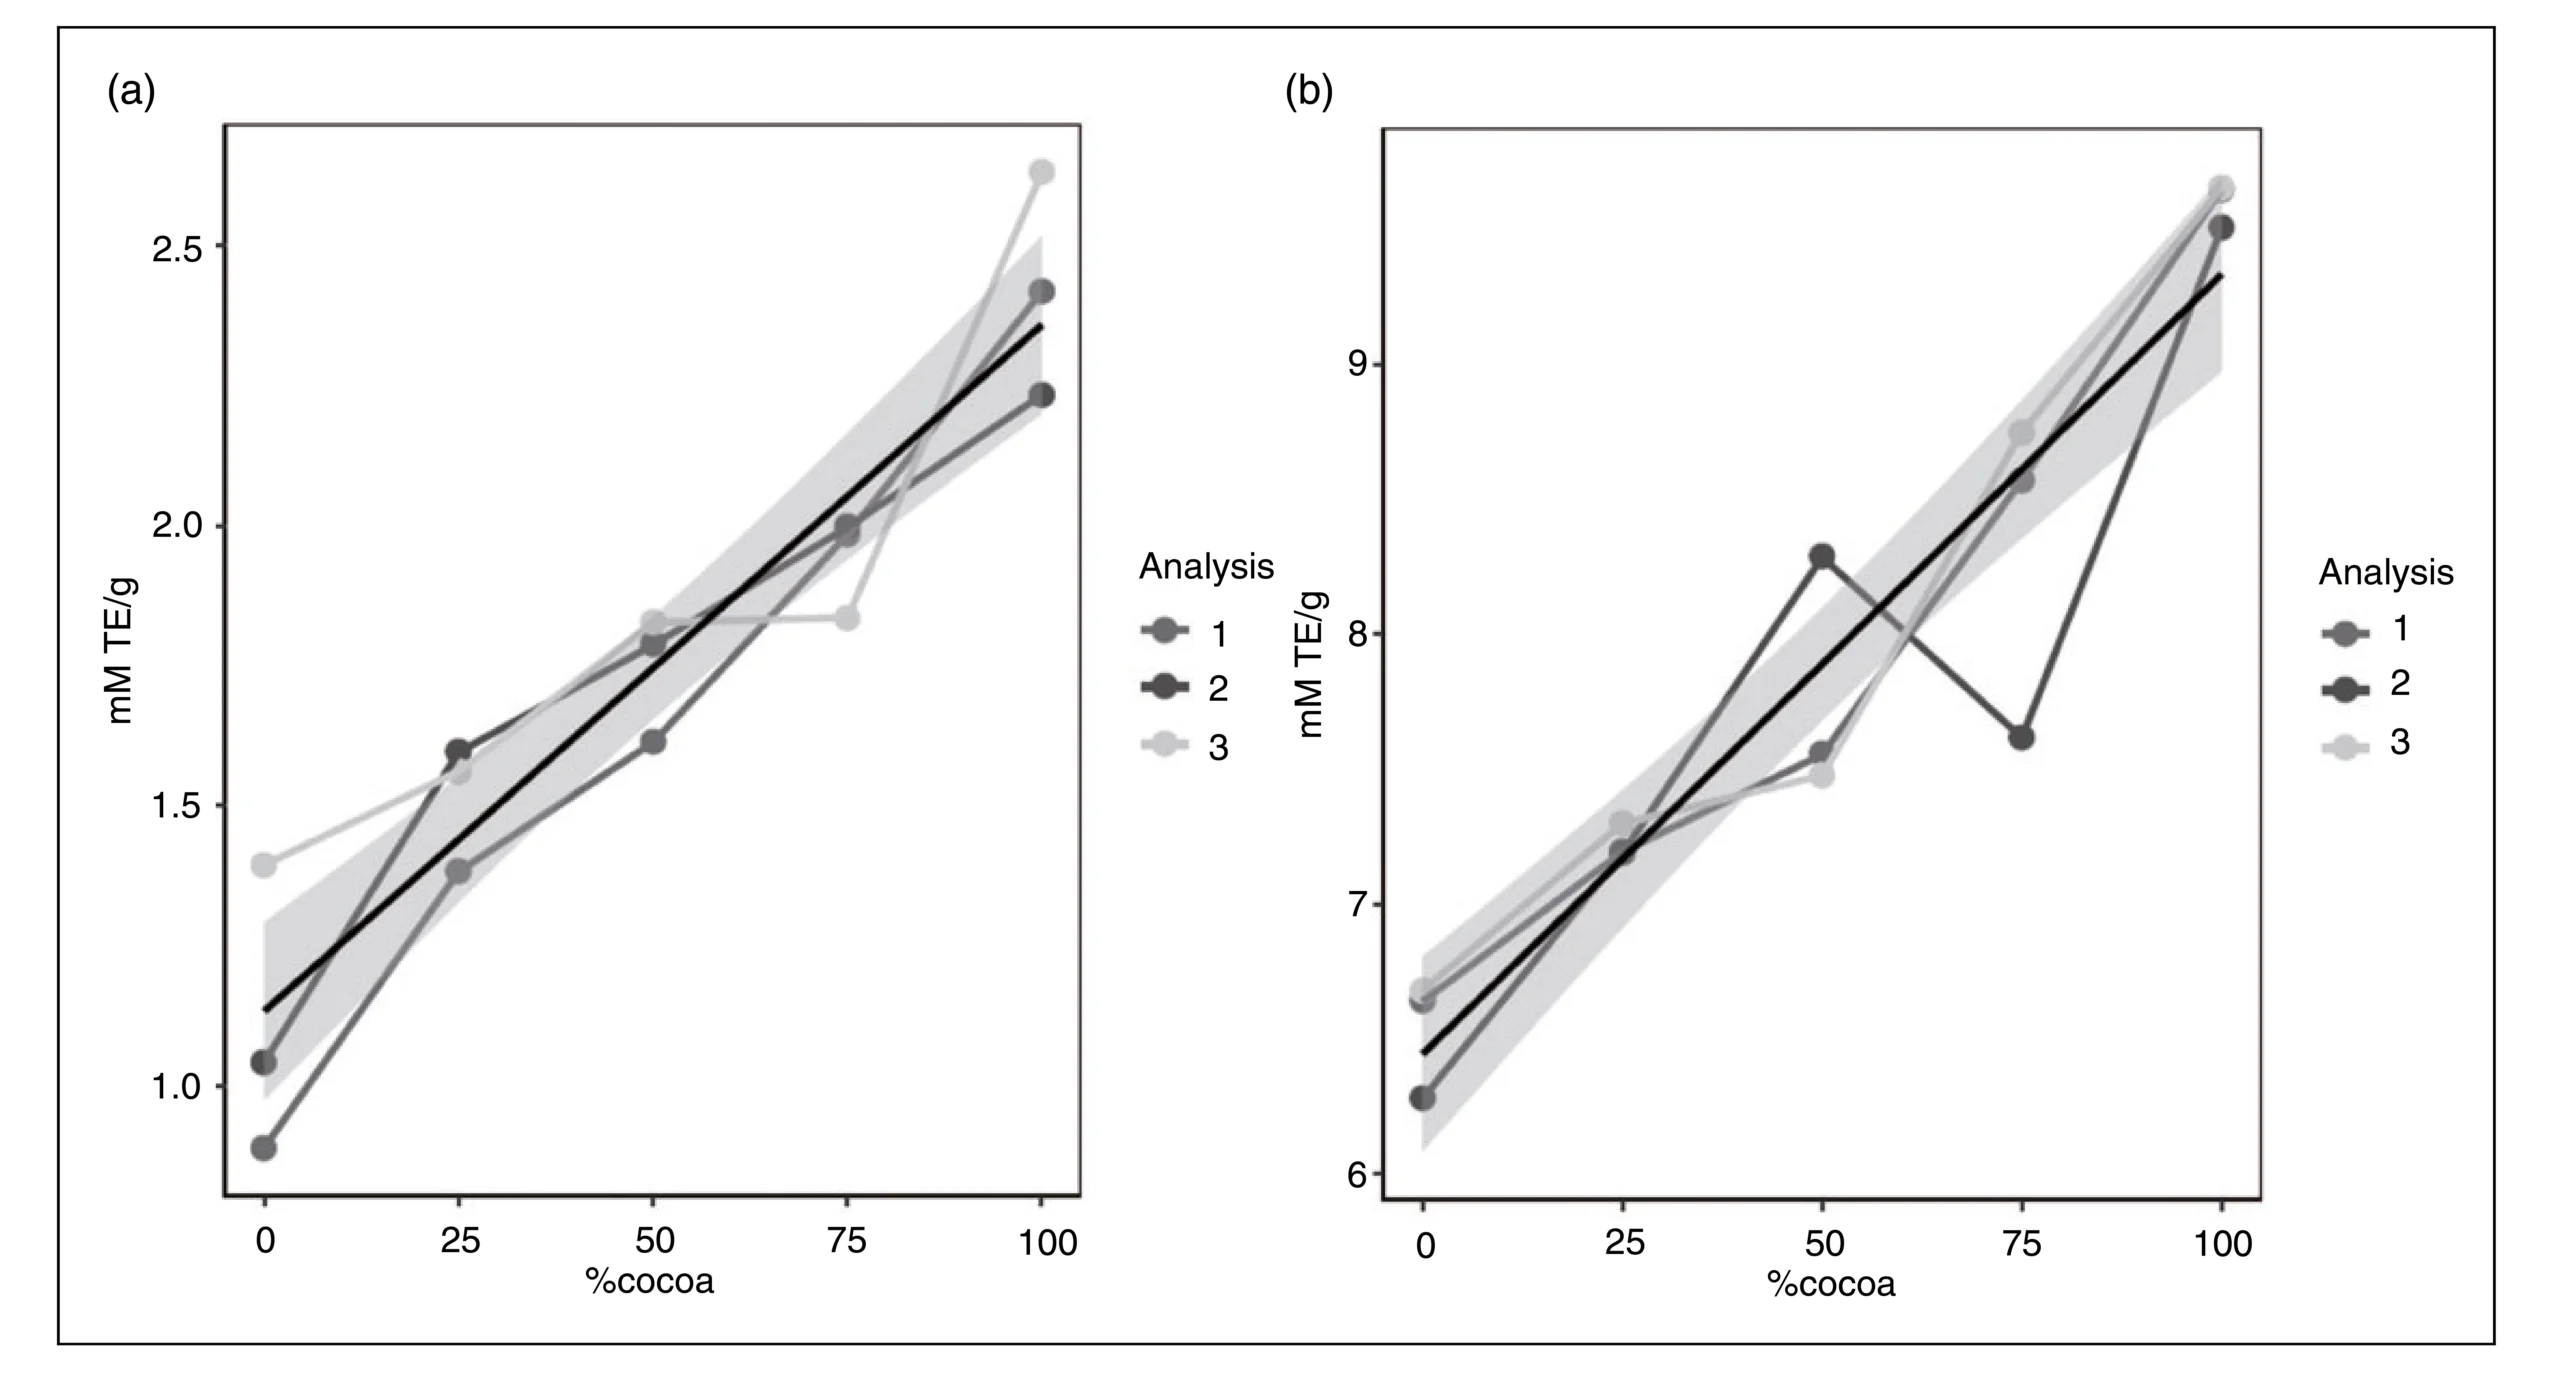 Figure 1. Antioxidant capacity of cocoa-coffee mixtures determined by the DPPH (a) and ORAC (b) methodology (The values 1, 2, 3 correspond to the means of three analyses). concentrations to inhibit a significant number of free radicals. This attribute is desirable in ingredients intended to be used as sources of bioactive compounds of interest in functional foods design, mainly because the high AC of cocoa could achieve similar functional effects with low doses. These results agree with some authors, whose have reported AC values in unfermented cocoa beans based on the DPPH-assay, such as 0.367 mM TE/g dw (Ramirez et al., 2013; Zapata et al., 2013). Thus, the AC described currently in the literature is lower than the presented in this work. This result could be because the unfermented cocoa beans used in this study have undergone a process to concentrate phenolic compounds through a hydroalcoholic treatment which usual exhibit higher concentration.
 The IC50 (half maximal inhibitory concentration) corresponds to the quantity of compound required to inhibit 50% of the DPPH radical (Sabahannur et al., 2018). This indicator is used in the pharmaceutical field to establish a drug’s concentration to inhibit 50% of a particular biological process (Navre, 2019). The IC50 of the cocoa-coffee mixtures with high antioxidants content was calculated to identify their radical scavenging potential. In this aspect, 100% coffee and cocoa extracts (samples M1 and M5, respectively) presented differences among the mixtures. M1 (0:100) showed the highest value of IC50 (15.030 mM TE/g dw) and M5 (100:0) the lowest one (9.976 mM TE/g dw), indicating that a lower amount of cocoa in the mixtures would allow achieving 50% inhibition of the radical, while it is required up to 5-times higher coffee extract than cocoa to attain similar effects.
Moreover, regarding IC50, no statistically significant differences (p > 0.05) were found between mix- tures, which presented a significantly lower inhibition capacity than 100% coffee extract. Indeed, the cocoa-coffee mixtures’ IC50 values decreased in parallel with the cocoa percentage increase in the mix. So, this result noticed a close relation between both extracts, demonstrating a dependency on the concentration of cocoa to reach an optimal effect with a low dose.
 The interaction between the mixes was defined by the value obtained in the combination index (CI). In this aspect, some authors have described that a CI 1⁄4 1 between two antioxidants can be considered additive, a CI > 1 antagonistic, a CI < 1 synergistic (Enko and Gliszczynska- Swig ło, 2015). However, Muhammad et al. (2017), referring to the work done by Chou (2006), provided additional details essential for a more accurate establishment of the interaction between two given antioxidants by presenting intermediate ranges of CI as follows: 0.3–0.7 (synergetic), 0.7–0.85 (moderate synergetic), 0.85–0.90 (slight synergetic), 0.90–1.10 (nearly additive), 1.10–1.20 (slight antagonistic), 1.20–1.45 (moderate antagonistic), and 1.45–3.3 (antagonistic) (Chou, 2006). Based on this information and the results obtained for the CI values presented in Table 4 is possible to say that as increased, the percentage of cocoa in the mixtures increased the synergistic interactions between antioxidant extracts, although this synergism was slight. In this regard, the cocoa coffee mixtures 25:75, 50:50, and 75:25 exhibited moderate antagonism, nearly additive, and slightly synergistic behaviors, respectively. This classification is relevant because it allows establishing the combined effects of two compounds supplied together, which may have more significant benefits (Lane et al., 1999). Based on these premises and according to the results from this study, the proportion of cocoa plays a central role in the interaction type definition.
Currently, there is a gap of information about the interaction between phenolic compounds of cocoa and coffee; few studies to date have described this. In respect to this interaction, Ribeiro et al. (2014) showed how the mixture of 94% roasted coffee powder (Coffea canephora cv. Robusta and Coffea arabica, 70:30, w/w), 3% cocoa powder, 2% coffee silverskin, and 1% golden coffee, is featured by a high content of phenolic compounds relative to other types of commercial coffee. However, the synergistic/antag- onistic interaction between antioxidants present in these products was not analyzed. On the other hand, C ̧elik and Gokmen (2018) provided valuable information on the interactions between the insoluble fractions of different coffee infusions and main cocoa flavanols (catechin and epicatechin), just as the interactions between other coffee infusions with dark chocolate.
 According to this study, for the insoluble fractions with cocoa flavanols, the AC values were between 0.953 1.84 mM TE/g dw. For the coffee infusions and dark chocolate, the AC was between 0.045–0.105 mM TE/g dw. In the first case, the CI was higher than the AC of the mixtures assessed in the present study. However, it is important to clarify that the products referenced in this studies corresponded to the evaluation between coffee products enriched with pure compounds as catechins, while in the present research, were evaluated concentrated extracts. Additionally, the interactions between the insoluble fractions and the pure catechins presented additive (CI 1⁄4 1) and antagonist (CI > 1) synergies, respectively. Interactions between coffee infusions and dark chocolate were synergistic (CI < 1). These results highlight that the interactions between cocoa and coffee don’t have a pattern of interaction, which seems to be influenced by the purity of the compounds or their concentration.
Orac-based antioxidant capacity
The average ORAC value for 100% coffee extracts was 6.532 mM TE/g dw. In this matrix, Narita and Inouye (2012) reported ORAC-based antioxidant values for Arabica green coffee extracts using water as a solvent (similar process to obtaining the coffee extract characterized in the present work), ranging between 0.354– 2.629 mM TW/g dw. Besides, Getachew and Chun (2017) evaluated the AC of green coffee (Coffee arabica) extracts from different origins, using subcritical water extraction method to modify the native structure of the polysaccharides present in the coffee matrix. The values reported in this study were 0.06–0.08 mM TE/g dw. Hence, the cocoa extract’s AC evaluated in this study presents a superior performance compared to some values reported in the literature (Narita and Inouye, 2012). The 100% cocoa extracts exhibited an average ORAC-based AC of 9.603 mM TE/g dw. On the other hand, Ca ́diz-Gurrea et al. (2014) reported the ORAC-based AC of different fractions of cocoa phenolic compounds that ranged between 1.4 and 9.6 mM TE/g dw, corresponding 100% cocoa to the upper limit of this range. This fact suggests a high AC for this type of extract, even higher than the 100% coffee extract achieved.
 Concerning the other mixtures characterized in the present work, no statistical differences were found between 25:75 nor between 75:25 cocoa-coffee mixtures (Figure 1b and Table 4). According to these results, this study evidences that cocoa extracts have a higher antioxidant capacity than coffee extracts. We could emphasize that the cocoa extracts are a valuable source of polyphenols for enriching food products with antioxidant phenolic compounds. Additionally, the use of these natural compounds in the elaboration of functional products could protect the cells from oxidative stress, which entails health benefits associated with reducing the risk of cardiovascular diseases and atherosclerosis (Martinez et al., 2020).
Bioavailability analysis
In the last years, several studies have demonstrated the bioavailability of phenolic compounds, describing that most of them are easily detected in plasma after consumption of plant-based foods (Parada and Aguilera, 2007). Generally, the potential of a bioactive compound depends on its bioavailability. It has been demonstrated using a Caco-2 cells monolayer model, an in vitro experimental approach that simulates the so-called “transepithelial transport” occurring in the small intestine (Herrera et al., 2012). Thus, this cellular model has been internationally used to study drug absorption (Fernandes et al., 2012). In food research, this model has allowed observing some light on the benefits to human health of plant-based foods since once demonstrated their content of beneficial bioactive compounds, establishing the extent to which such compounds are absorbed at the gastrointestinal level (Colorado, 2017).
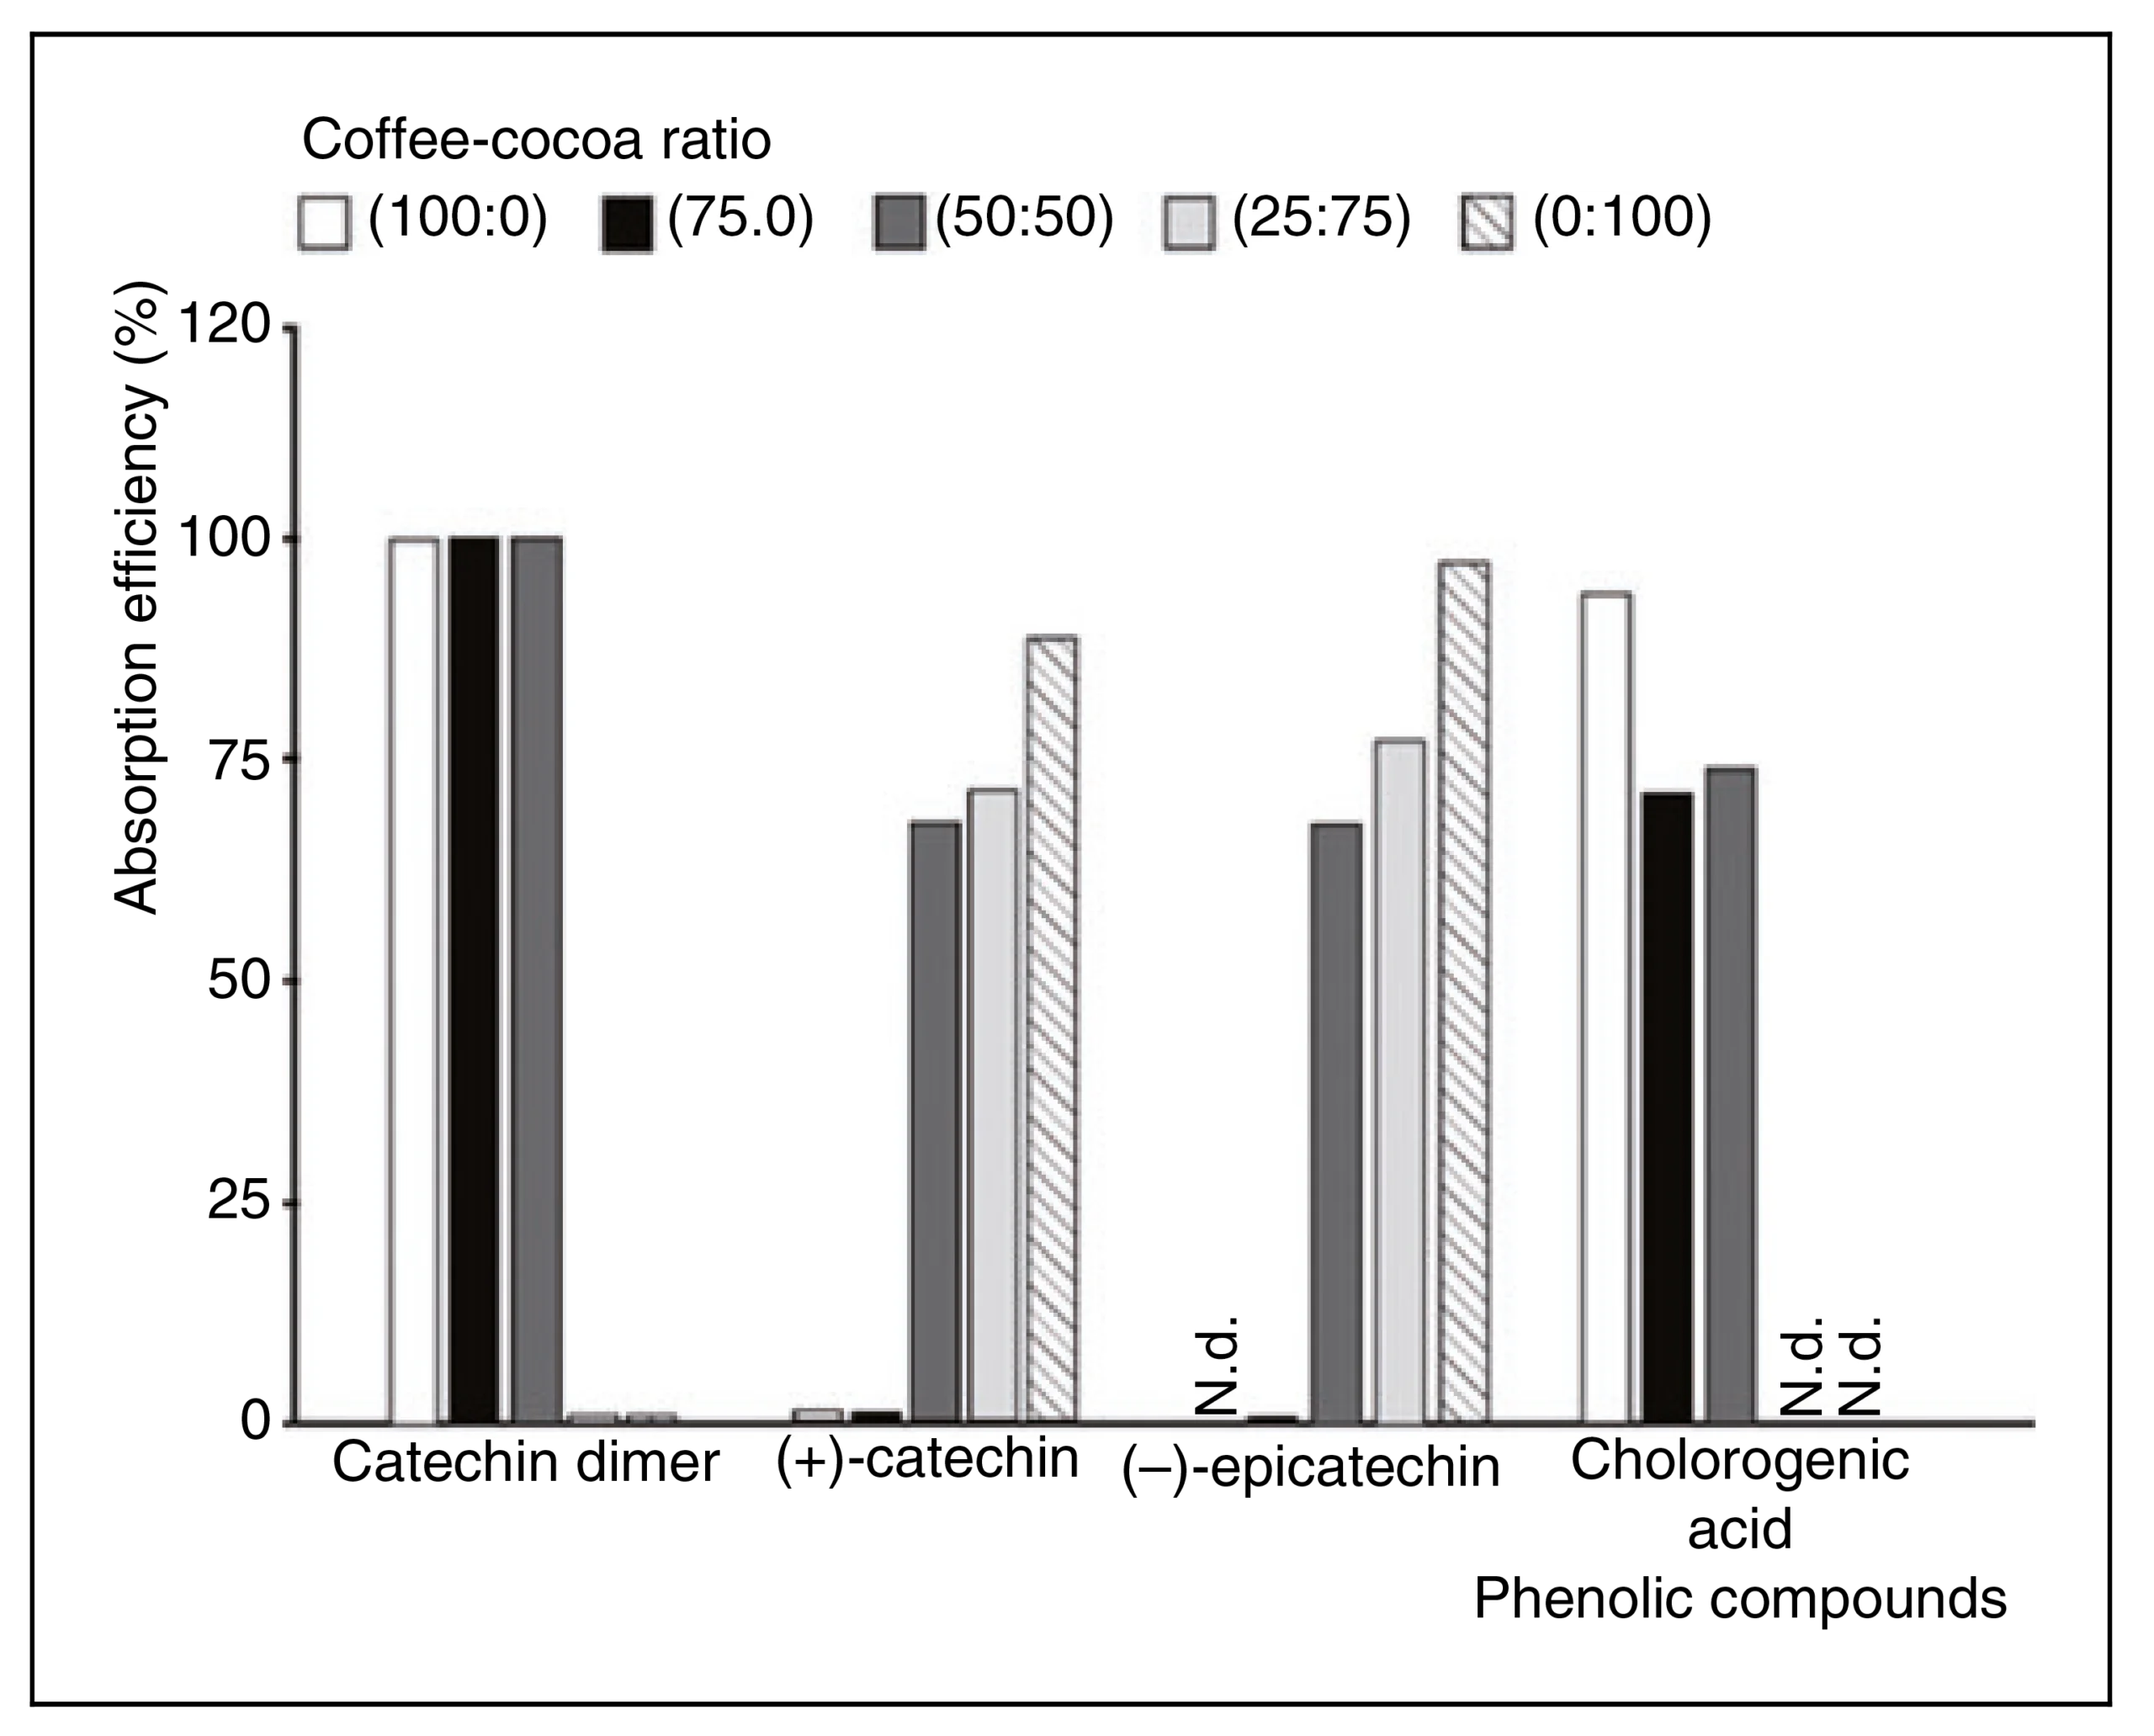 Figure 2. Absorption efficiency (%) in Caco-2 cells after 120 min. Results representatives of two independent experiments. N.d.: not detected.
Based on these, the absorption of polyphenols present in cocoa, coffee, and different cocoa-coffee mixtures can be studied using this in vitro model. The compounds detected in higher concentrations were a catechin dimer, (þ)-catechin, (–)-epicatechin, and chlorogenic acids. They were the most predominant in the pure extracts evaluated and were assessed on their capacity to cross the intestinal barrier. On this fact, other authors have reported that the transport of cocoa flavanol through Caco-2 cells monolayer is associated primarily with catechin monomers and dimers (Kosinska and Andlauer, 2012). The absorption of these compounds was calculated as the percentage of the target phenolic in the basolateral chamber relative to the concentration of compounds added in the apical chamber medium after 120 min. Thus, Figure 2 shows the percentage of transport (absorption efficiency) of the phenolic compounds.
 In the case of catechin dimer found in the cocoa-coffee mixtures assessed, this presented an absorption efficiency ranging between 59% and 93%. In this regard, the 100%-coffee extract showed the highest percentage of this compound (93.6%). Although this compound was not identified, it is important to mention that cocoa and coffee can contain this type of phenolic structures. Cocoa flavanols can be monomers (catechin and epicatechin) and dimers or oligomers (procyanidins) (Quinones and Aleixandre, 2012). ~ Regarding the bioavailability of these compounds, some authors have reported that transepithelial transport of procyanidins does not occur or has a low absorption rate (<5%). Mnatsakanyan et al. (2010) also reported the presence of some dimers present in the coffee (carboxylic acids) To the (þ)-catechin was observed to increase transport efficiency in parallel with the cocoa percentage rise in the mixture. This behaviour has a direct relation with the concentration of this compound in the mixes.
 This compound was not detected in the basolateral compartment during the bioavailability assay of the extracts that exhibited the lowest cocoa ratio in the mixture (100% coffee and 25:75 cocoa-coffee mixtures). This result could be a consequence of its degradation under the culture conditions (37 C and 70% humidity) during the assay (2 h). In contrast, in extracts featured by higher ratios of cocoa in the mixtures (50%–100%), which displayed a higher (þ)-catechin concentration between 36.90 and 51.51 mg/mL, the bioavailability verified was up to ca. 88% (Figure 2), without statistically significant differences 50:50 and 75:25 cocoa coffee mixtures, as well as 100% cocoa.
The presence of (–)-epicatechin was found in the basolateral compartment (bioavailable fraction) in the 50:50 and 75:25 mixtures (67% and 77%, respectively); as well as when applying the 100% cocoa extract (97.0% of bioavailability), this is similar with the bioavailability described in the literature (Kieu et al., 2020). However, no statistically significant differences between the diverse extracts analyzed were observed (Figure 2). Finally, the identification of bioavailable chlorogenic acid was in all extracts with the highest coffee extract values and decreased in 25:25 and 50:50 cocoa-coffee mixtures. In the 75:25 mix and 100% cocoa, these compounds were not detectable (Figure 2).
Not many studies on the bioavailability of cocoa polyphenols have been reported using the Caco-2 cells monolayer model of the intestinal barrier. Gomez-Juaristi et al. (2020) and Liu et al. (2016) described the bioavailability of flavanols and hydroxycinnamic acids (5-caffeoylquinic and 3,5-dicaffeoylquinic acids), demonstrating that chlorogenic acids are featured by a higher intestinal absorption than the flavanols.
CONCLUSIONS
The cocoa extract evaluated showed superior performance than the coffee extract in terms of antioxidant capacity. With a lower dose of cocoa extract, it is possible to reduce more radicals, demonstrating its potential effect on health significantly. Besides, this could be a cost advantage for the development of functional products. The antioxidant capacity of the mixtures was directly proportional to cocoa extract present in them (higher % cocoa, higher AC). In terms of bioavailability, both phenolic compounds present in the coffee and cocoa have high absorption efficiency, which is interest for the biological properties attributed to these compounds. The mixtures were not identified with a strong interaction between both extracts, which does not allow us to conclude about the real benefit of using them in combination. Instead, it is possible to mention that the cocoa and coffee extracts isolated have better potential functionality.
DECLARATION OF CONFLICTING INTERESTS
The author(s) declared no potential conflicts of interest withrespect to the research, authorship, and/or publication of this article.
FUNDING
The author(s) received no financial support for the research, authorship, and/or publication of this article.
ORCID IDS
Elly Acosta-Otálvaro https://orcid.org/0000-0003-4897-6478
Cristina García-Viguera https://orcid.org/0000-0002-4751-3917